Business Analytics > Predictive Modelling > Decision trees and classification models
Decision trees and classification models
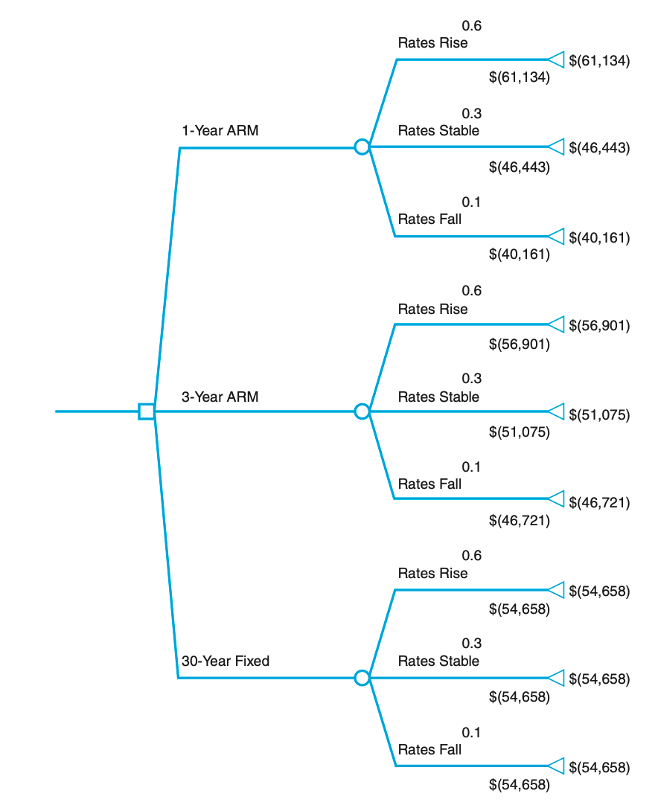
Decision Tree: A decision tree is a simple graphical tool used to make decisions under uncertainty. It has nodes and branches: Node represents using square symbol indicates events and decision points and circle symbol indicates uncertain events which is not under control. A triangle shows the final result
Decision trees help people easily understand and analyze decisions and outcomes over time.
Classification Model
A classification model is a type of machine learning model used to predict a category or class for new data. Unlike regression, which predicts continuous values, classification predicts discrete labels. In machine learning, it learns patterns from data and create an abstract model. Using that model it uses new data as input and predict class for that new data.
For example: To predict whether an email is a Spam or not, it will observe some data and will create a model as
- Input: email features (keywords, sender, links)
- Output: Spam or Not Spam
Accuracy: Accuracy measures the proportion of correct predictions in any model. For example, in logistic regression we convert predicted probabilities into classes (0 or 1) using a threshold i.e. 0.5. Now we can count how many predictions match the actual outcomes.
i.e.
ROC Curve
A Receiver Operating Characteristic (ROC) curve is a graphical plot which shows the performance of a binary classification model across all classification thresholds.
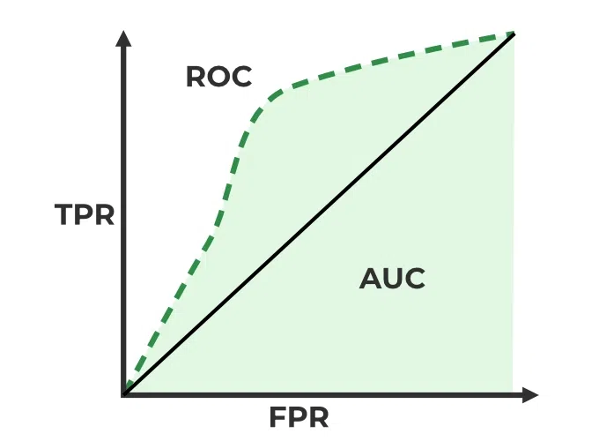 It can be constructed by graphing the True Positive Rate (Sensitivity) against the False Positive Rate (1- specificity). So it shows the trade-off between s True Positive Rate and False Positive Rate at different thresholds. When curve closer to top-left corner the model is better and when closer to diagonal line the model is no longer better than random guessing. Performance of a model can be quantify from a ROC curve by calculating the Area Under the Curve (AUC).
Logistic Regression
No More
Feedback
ABOUT
Statlearner
Statlearner STUDY
Statlearner