Data Analysis Using Python > Descriptive Statistics > Density curve for continuous data
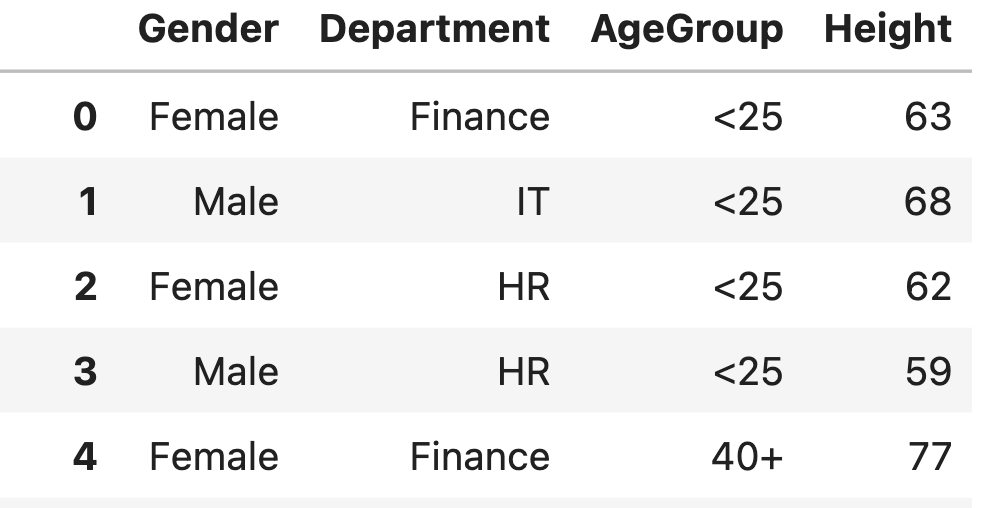
Let you have a data file "Employees.xlsx" and you are working in Google Colab. to read the data file the following codes:
from google.colab import files
import pandas as pd
uploaded = files.upload()
df = pd.read_excel(list(uploaded.keys())[0])
df
import pandas as pd
import numpy as np
import matplotlib.pyplot as plt
import seaborn as sns
sns.kdeplot(df["Height"], fill=True, color="skyblue", linewidth=2)
plt.title("Density Curve of Heights")
plt.xlabel("Height (inches)")
plt.ylabel("Density")
plt.show()

Feedback
ABOUT
Statlearner
Statlearner STUDY
Statlearner