Data Analysis Using Python > Descriptive Statistics > Python code for Frequency Table of continuous data
Let you have a data file "Employees.xlsx" and you are working in Google Colab. to read the data file the following codes:
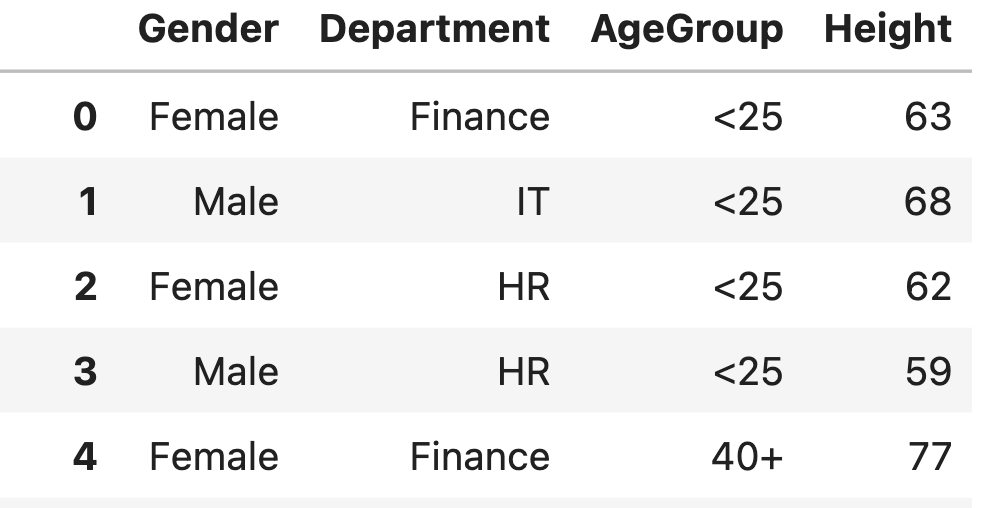
Now to construct a frequency table for height column forst Recode (bin) continuous height into categories. First we need to select some break points including lower and upper boundaries. So we have to have n+1 points for n categories. these bin points will recode the heght data column using panda.cut function.
import pandas as pd
import numpy as np
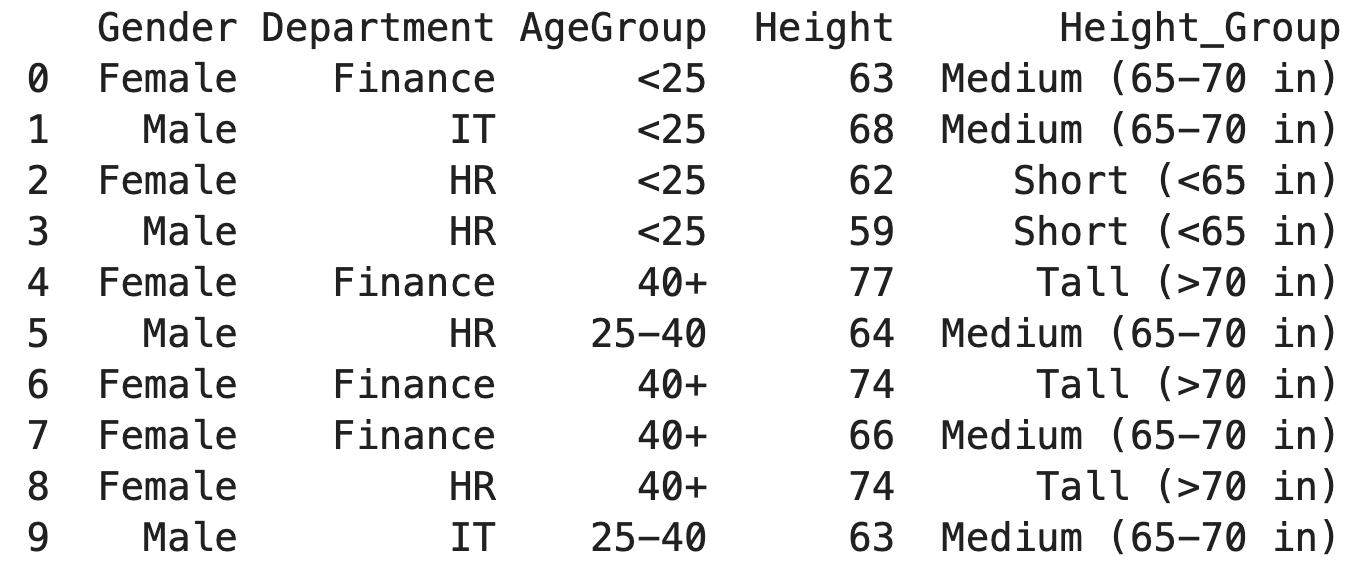
bins = [0, 64,70,100]
labels = ["Short (<65 in)", "Medium (65-70 in)", "Tall (>70 in)"]
df["Height_Group"] = pd.cut(df["Height"], bins=bins, labels=labels, right=True)
print(df.head(10))
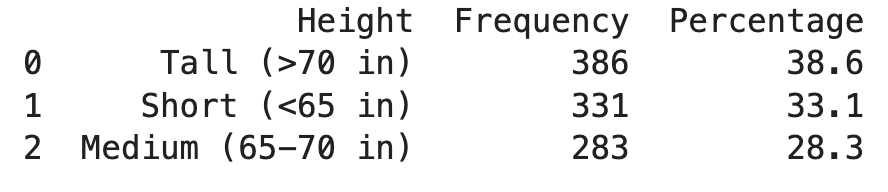
# Adding percentage column
freq_table['Percentage'] = (freq_tab['Frequency'] / freq_tab['Frequency'].sum()) * 100
print(freq_tab)
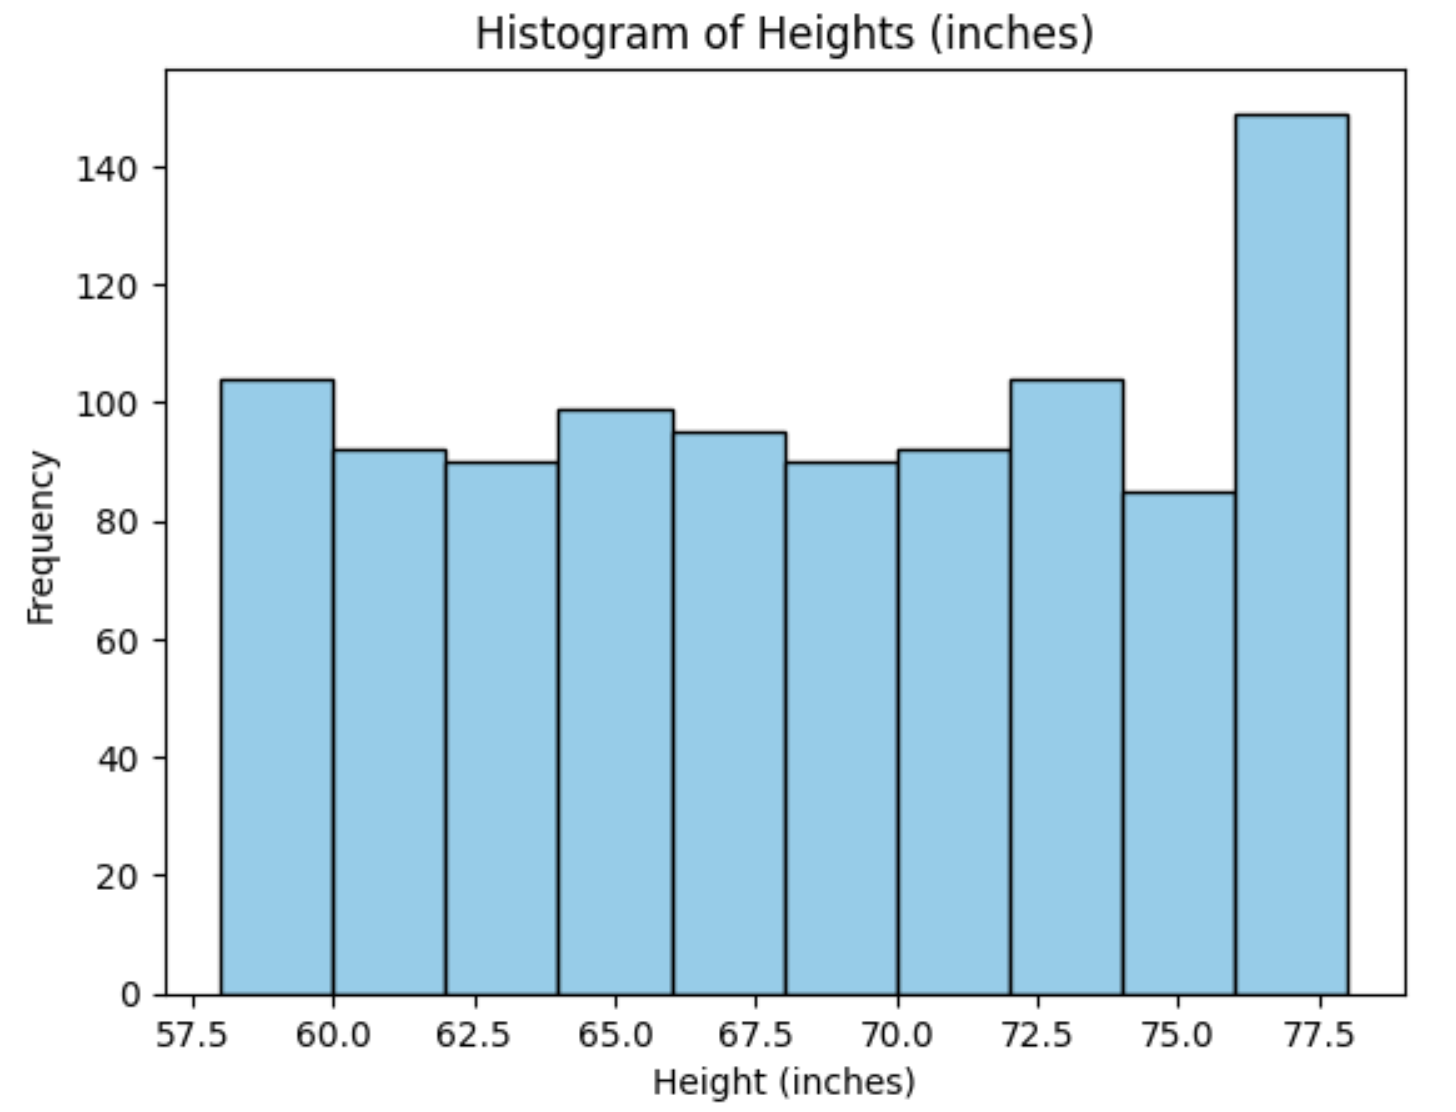
import matplotlib.pyplot as plt
plt.hist(df["Height"], bins=10, color="skyblue", edgecolor="black")
plt.title("Histogram of Heights (inches)")
plt.xlabel("Height (inches)")
plt.ylabel("Frequency")
plt.show()
Feedback
ABOUT
Statlearner
Statlearner STUDY
Statlearner