Data Analysis Using Python > Correlation > What is Correlation Coefficient?
Correlation Coefficient:
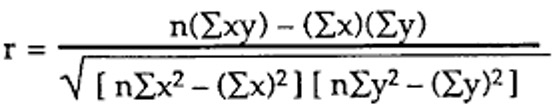
The correlation coefficient is the specific measure that quantifies the strength of the linear relationship between two variables in a correlation analysis
Calculating formula of Correlation Coefficient:
Some points we should know about correlation coefficient
- It is also called Pearson's correlation or product moment correlation coefficient.
- It measures the nature and strength between two variables of the quantitative type.
- The sign of r denotes the nature of association
- while the value of r denotes the strength of association.
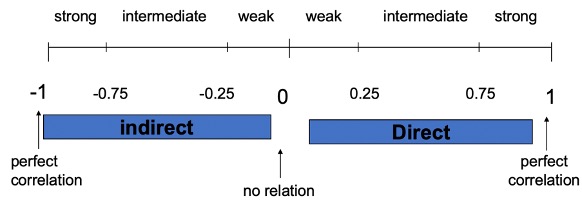
- If the sign is +ve this means the relation is direct (an increase in one variable is associated with an increase in the other variable and a decrease in one variable is associated with a decrease in the other variable).
- While if the sign is -ve this means an inverse or indirect relationship (which means an increase in one variable is associated with a decrease in the other).
- The value of r ranges between ( -1) and ( +1)
- The value of r denotes the strength of the association as illustrated by the following diagram.
Coefficient of Determination
It is often difficult to interpret r without some familiarity with the expected values of r.
A more appropriate measure to use when interest lies in the dependence of Y on X, is the Coefficient of Determination, R2. It measures the proportion of variation in Y that is explained by X, and is often expressed as a percentage.
Let’s assume that R2 = 0.19 we can say that 19.4% of the variability in the income poverty proxy measure is accounted for by the number of persons per sleeping room. Clearly there are many other factors that influence the poverty proxy since over 80% of the variability is left unexplained.
- R2 is useful in regression studies to check how much of the variability in the key response can be explained.
- R2 is most valuable when there is more than one explanatory variable. High values of R2 are particularly useful when using the model for predictions!
Using Numpy
import numpy as np
wt = [67, 69, 85, 83, 74, 81, 97, 92, 114, 85]
sbp = [120, 125, 140, 160, 130, 180, 150, 140, 200, 130]
corr_matrix = np.corrcoef(wt, sbp)
corr_coeff = corr_matrix[0, 1]
print(f"Correlation coefficient: {corr_coeff:.4f}")
Output:
Correlation coefficient: 0.7398
Using Panda DataFrame:
Feedback
ABOUT
Statlearner
Statlearner STUDY
Statlearner