Information Theory and Coding > Entropy > Average Information Content of Symbols
Average Information Content of Symbols in Long Independence Sequences
Suppose that a source is emitting one of M possible symbols s1, s2 ….. sM in a statically independent sequence. Let p1, p2, …….. pM be the probabilities of occurrence of the M-symbols respectively. Suppose further that during a long period of transmission a sequence of N symbols have been generated.
On an average –
S1 will occur NP1 times
S2 will occur NP2 times
……..
Si will occur NPi times
The information content of the i-th symbol is I(Si ) = - log Pi bits
NPi occurrences of si contributes an information content of -NPi log Pi bits
Average information content per symbol H = sum (-Pi log Pi ) i= 1,2 …M
Average information content of sequence H = sum (-Pi NPi log pi ) i= 1,2 …M
Average information content per symbol is also called the source entropy
Example:
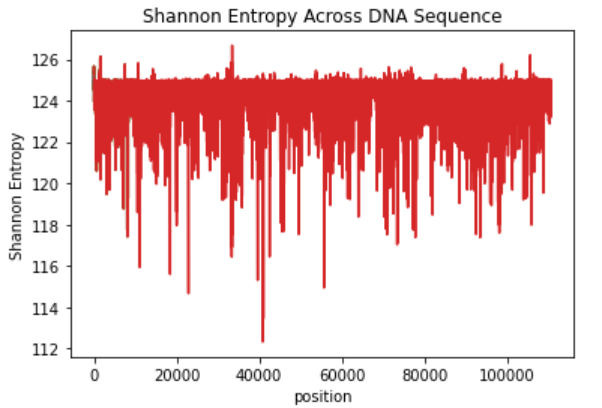
Suppose we have a DNA sequence and interested to know which area in the chromosome is more or less "surprising" and have higher information content. The following is DNA sequence and first we will consider first segment of 20 nucleotides.
ACGTACGTAACCATGACTACTACAGGGTACTACA ….. ATGCSCATGTTGGACCA
Relative frequency of A is P(A)=7/20, P(C)=6/20, P(G)=3/20 and P(T)=4/20
Average information content per symbol H = - sum[ Pi * log2Pi ]; i=A,C,G,T
Average information content of sub-sequence H = - sum[NPi * Pi * log2Pi ] i= 1,2 …M
Repeat for next sub-sequence until End:
- Select next sub-sequence by shifting 5 nucleotides and calculate Average information content of sub-sequence H
- Plot H against sub-sequence number
We will get the following like graph
Feedback
ABOUT
Statlearner
Statlearner STUDY
Statlearner