Data Analysis > Correlation and Regression > Correlation coefficient Between two variables
Correlation coefficient Between two variables
In this lesson, for practicing purpose we will use default dataset mtcars, supplied by R. This data set automatically loaded. No need extra command to load it.
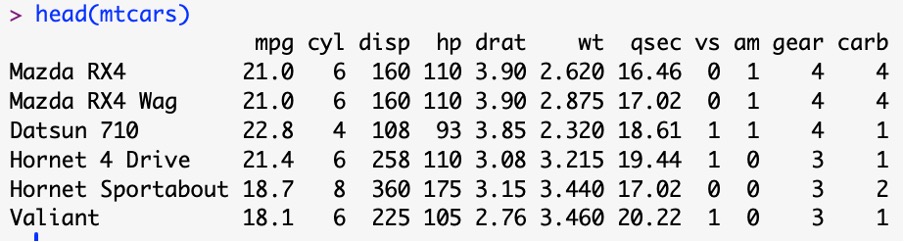
There are 32 data rows with 11 columns. Let us calculate correlation between miles per Gallon and Horse power. i.e. correlation between mpg and hp.
Scatterplot for mpg and hp
It should be wise to visualize a correlation between mpg and hp is to draw a scatterplot of the them.:
library(ggplot2)
ggplot(mtcars) +
aes(x = hp, y = mpg) +
geom_point(colour = "#0c4c8a") +
theme_minimal()
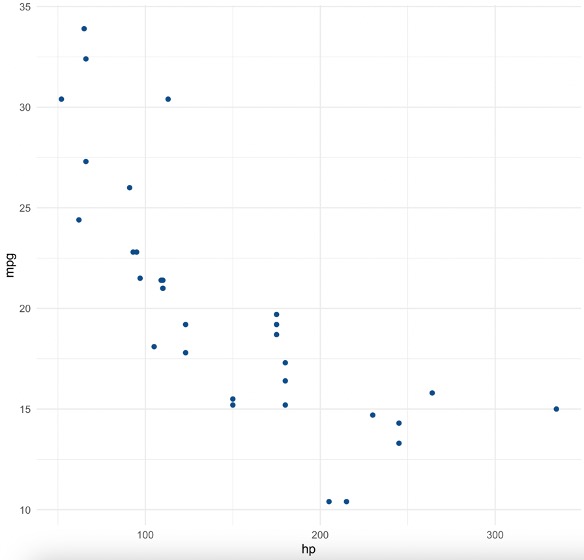
theme_minimal() means only basic minimum theme will be used with clean background, no gridlines or extra styling.
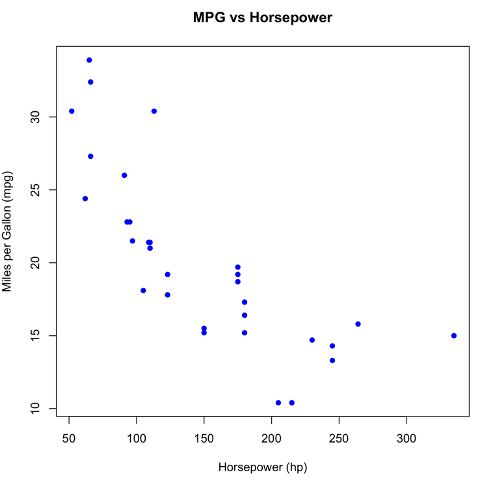
Or using R base command:
plot(mtcars$hp, mtcars$mpg,
main = "MPG vs Horsepower", xlab = "Horsepower (hp)",
ylab = "Miles per Gallon (mpg)", col = "blue", pch = 16)
# Pearson correlation between mpg and hp
> cor(mtcars$hp, mtcars$mpg)
[1] -0.7761684
The above correlation is negative and strong correlation. Since it is greater than .75 we can consider it strong correlation (Rule of thumb). Note that this correlation is suitable for when relation are assumed linear, data is continuous, and follows normal distribution.
To test whether this significantly different from 0 or not in the population and it’s p-value:
Actually, a correlation coefficient different from 0 in the sample does not mean that it is significantly different from 0 in the population. This needs to be tested with a hypothesis test and the test is known as the correlation test.
The null and alternative hypothesis for the correlation test are as follows:
- H0: ρ=0 (there is no linear relationship between the two variables)
- H1: ρ≠0 (there is a linear relationship between the two variables)
If null hypothesis is rejected, we will conclude that sample contains sufficient evidence to reject the null hypothesis and conclude that the correlation coefficient does not equal 0, so the relationship exists in the population. Otherwise sample does not contain enough evidence that the correlation coefficient does not equal 0,
There are 2 assumptions for this test to be valid:
- Independence of the data. i.e. mgp and hp are independent to each other.
- For small sample sizes (usually n<30), the mpg and hp should follow normal distribution.
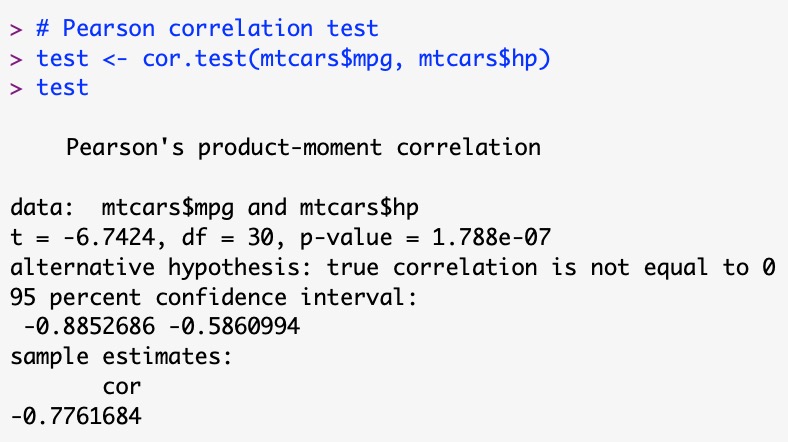
Since p-value is close to zero. Null hypothesis is rejected i.e. correlation is not zero in the population.
No More
Correlation coefficients and their tests for multiple variables
Feedback
ABOUT
Statlearner
Statlearner STUDY
Statlearner