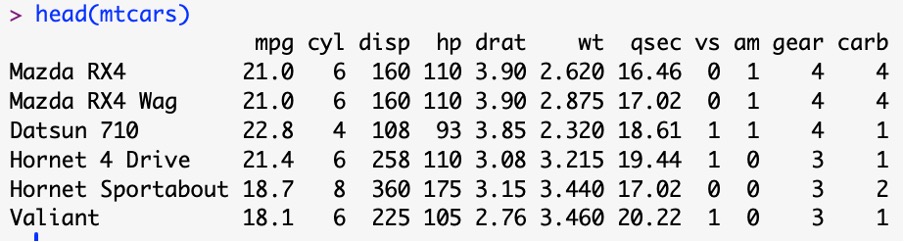
Data Analysis > Correlation and Regression > Linear Regression
Simple linear regression:
A linear regression is a statistical model that analyzes the linear relationship between a response variable ( y ) and one or more explanatory variables and their interactions (x).
Let us see the scatterplot of mpg and hp.
plot(mtcars$hp, mtcars$mpg,
main = "MPG vs Horsepower", xlab = "Horsepower (hp)",
ylab = "Miles per Gallon (mpg)", col = "blue", pch = 16)
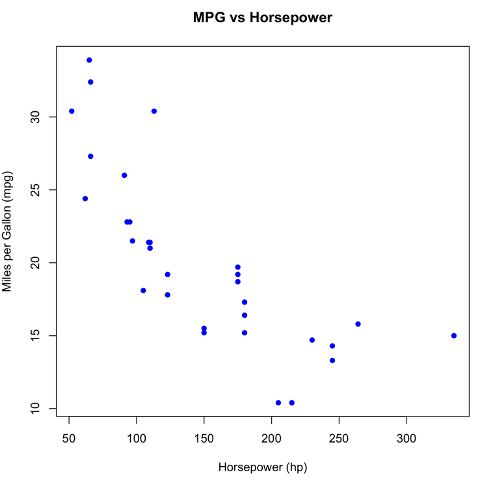
# Pearson correlation between mpg and hp
> cor(mtcars$hp, mtcars$mpg)
[1] -0.7761684
Their correlation is also strong and significance.
Now we are going to construct the following regression line:
mpg = a + b1×hp
We can construct a regression line using mtcars data where mpg will be response variable and hp will be the explanatory variable.
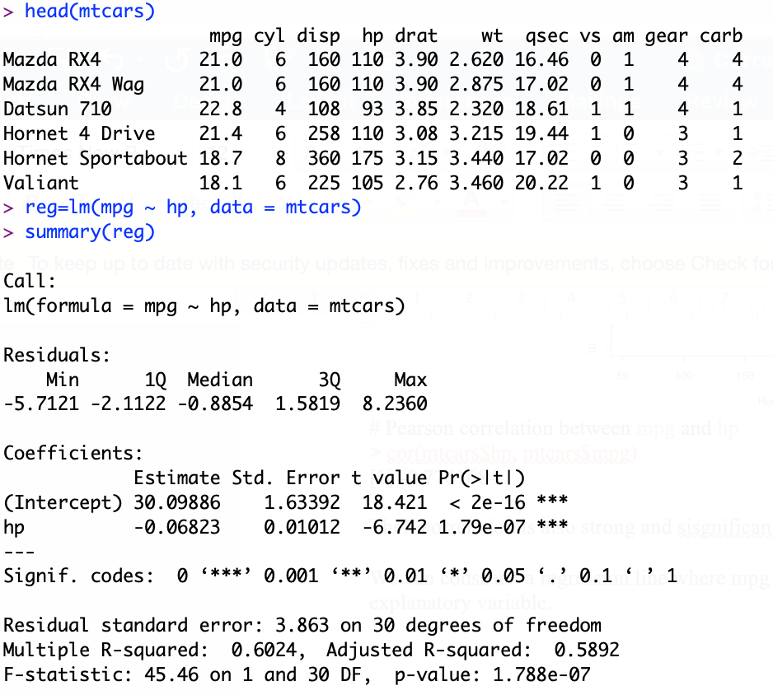
- The p-value for hp is 1.79*e-07 or 0.000000179. A very small value means that hp is probably an excellent addition to our model. i.e. hp has significant impact on mpg.
- R-square is 0.6024 indicates 60.24% variation of mpg can be explain by the variation of hp which is more acceptable.
- The p-value for F-statistic is 1.78*e-07 or 0.000000178. In other words, the relationship between response and explanatory variables is significant.
Multiple linear regression
If explanatory variavles are more than one then our contructed line will be called multiple linear regression.
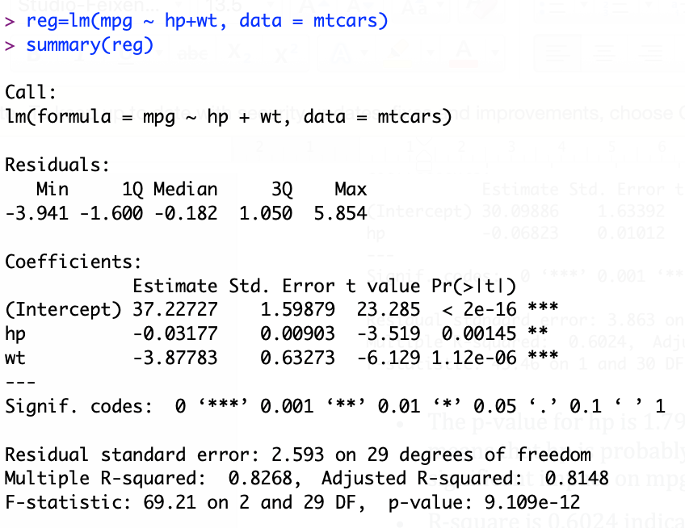
Here we can see that R-square is 0.8268, p-value of F-statistic is 9.109*e-12 and p-value of both the explanatory variables are significant (p-value<0.05).
Correlation coefficients and their tests for multiple variables
Correlation for ordinal variables
Feedback
ABOUT
Statlearner
Statlearner STUDY
Statlearner