Business Analytics > Foundations of Business Analytics > Evolution of Business Analytics
Evolution of Business Analytics:
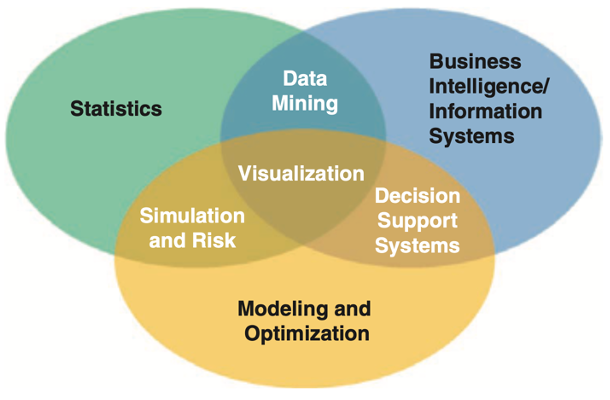
The core of business analytics consists of three disciplines: business intelligence and information systems, statistics, and modeling and optimization.
Analytic Foundations: Business analytics began with the introduction of computers in the late 1940s. Early computers made it easier to store, manage, analyze, and report data—tasks that were difficult to do manually. This led to the development of business intelligence (BI), a term coined in 1958, which helps answer questions like “How many products were sold last month?” or “Which customers spent the most?” BI can also flag exceptions automatically, such as large bank transactions that need reporting.
Statistics became an important part of business as data grew. Statistical methods allow analysts to summarize data, find patterns, and uncover relationships. These methods range from basic descriptive tools to advanced techniques like regression, forecasting, and data mining.

Operations Research (OR) / Management Science (MS) emerged from military problem-solving during World War II. After the war, these mathematical and computer-based methods were applied to business problems. OR/MS focuses on modeling and optimization to find the best solutions. Today, professional societies like INFORMS support this field.
Modern business analytics integrates BI/IS, statistics, and modeling. Its key aspects include:
- Data mining: Discovering patterns and relationships in large datasets.
- Simulation and risk analysis: Evaluating uncertainty and its impact on decisions.
- Decision Support Systems (DSS): Computer systems that combine data, models, and interfaces to help make decisions. DSS supports what-if analysis to see how changes in inputs affect outcomes.
 |
 |
  |
Visualization is central to business analytics. Visual tools help communicate insights clearly, reveal patterns, and support decision-making. Examples include dashboards, charts, tag clouds, and scorecards. Organizations like UPS and the Cincinnati Zoo use visualization to improve operations and strategy.
Differences between Business Analytics and Business Intelligence
Some Popular Business Analytics Tools
Feedback
ABOUT
Statlearner
Statlearner STUDY
Statlearner